

How to Read Your Meta Events Manager Without Going Crazy
Events Manager is the most underused and most misunderstood dashboard in the entire Meta ads ecosystem. Most brands open it once when they set up their pixel, see that something is green, and never look at it again. Others check it obsessively panic about numbers that do not matter and miss the signals that actually do.
Events Manager - is the dashboard that shows you how well your tracking is working. Ads Manager - shows you what your ads are doing. Events Manager shows you what your data is doing.
Most brands spend all their time in Ads Manager and almost no time in Events Manager. Little did they know that when your data is wrong, everything in Ads Manager is wrong too.
After 7 years building ad products at Meta and now running Aimerce where I look at dozens of Events Manager setups every week, I want to give you the clearest possible guide to what this dashboard is actually telling you. Let’s get into it.

Try Aimerce Pixel Risk-Free
for 30 Days
Most teams see results within 2 weeks.
Money-back guarantee.
It pays for itself, or you don't pay anything.
What Events Manager Actually Is (And What It Is Not)
Before getting into the specific numbers, the most important thing to understand is what Events Manager measures.
Events Manager tracks your tracking quality how accurately and completely your pixel and server-side integrations are capturing customer behavior on your site and sending it to Meta.
It is not your ad performance dashboard. That is Ads Manager.
The relationship between the two is Events Manager tells you whether the data feeding your ad algorithm is accurate. Ads Manager tells you what the algorithm is doing with that data. If your Events Manager data is bad, everything in Ads Manager is compromised but Ads Manager will not tell you that. It will just show you numbers that do not correspond to reality.
What to Look at First
When you open Events Manager and click on your pixel, you land on the Overview tab. Here is what each section means.
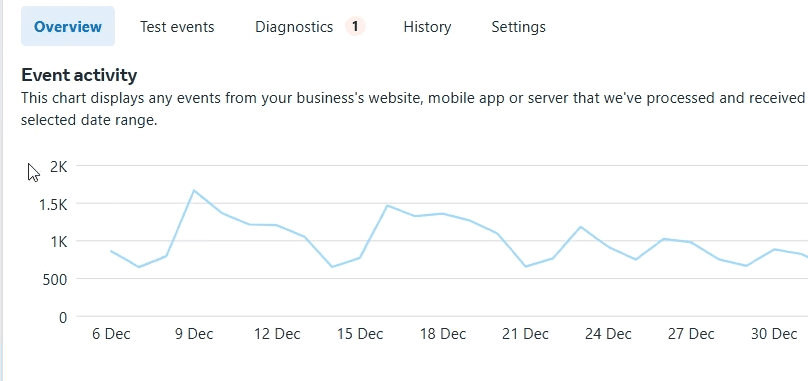
Event Activity Graph
The chart at the top shows the volume of events received over your selected time period. Each line represents a different event type PageView, ViewContent, AddToCart, InitiateCheckout, Purchase.
What you are looking for. Consistent volume and logical funnel ratios.
Your PageView volume should be the highest. It should drop progressively through AddToCart and InitiateCheckout to Purchase. A rough healthy pattern might look like: 10,000 PageViews, 2,000 AddToCart, 800 InitiateCheckout, 200 Purchases.
A sudden drop in any event type on a specific date is a red flag. That usually means something changed a Shopify app update, a GTM tag breaking, a checkout flow change that started dropping events. Find the date, find what changed that day.
Day-to-day volume fluctuations is fine as traffic varies. Do not panic if Tuesday looks lower than Monday.
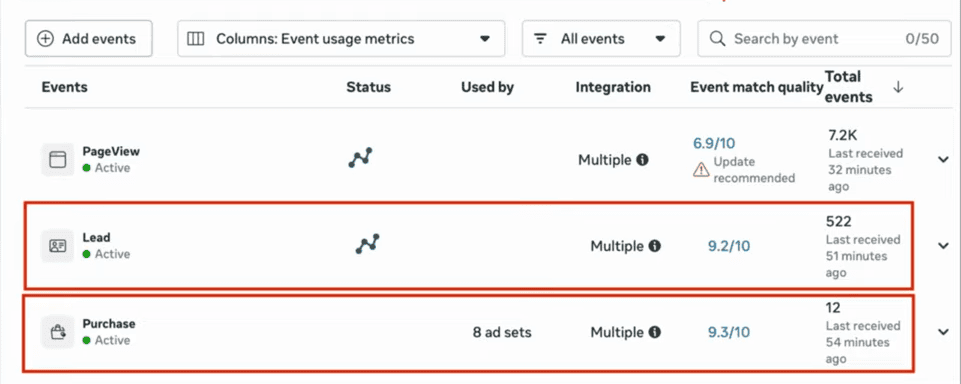
Event List and Integration Column
Conversions API = server-side events are reaching Meta. This is what you want to see for your Purchase event specifically.
Meta Pixel only = your purchase data is coming entirely from the browser. This means it is vulnerable to iOS restrictions, ad blockers, and browser tracking prevention. You are likely missing 20 to 40 percent of your conversions.
Multiple (or both) = both browser and server-side sources are active. Good as long as deduplication is also working correctly (more on that below).
Event Match Quality (The Number That Actually Matters)
The EMQ score is the single most important number in Events Manager for most Shopify brands. It is a score from 0 to 10 that measures how well Meta can match your event data to actual Facebook users.
Why does this matter? Because Meta's algorithm targets ads to people. To target effectively, it needs to be able to match your site visitors and purchasers to Facebook profiles. EMQ measures how well that matching is working.
Healthy EMQ ranges by event type:
| Event | Healthy Range | Concerning |
|---|---|---|
| Purchase | 8.8 to 9.3 | Below 8.0 |
| AddToCart / InitiateCheckout | 7.5 to 8.5 | Below 7.0 |
| ViewContent / PageView | 6.0 to 7.5 | Below 5.5 |
Higher funnel events naturally have lower EMQ because you have less customer data at those stages. A PageView EMQ of 6.5 is fine but a Purchase EMQ of 6.5 is a serious problem.
What drives EMQ up:
The main driver is the customer data parameters you send with each event. Email address and Click ID (fbc) are the two highest-impact parameters. After those: phone number, country, external ID, and browser ID (fbp).
If your Purchase EMQ is below 8.0, the most common cause is that your events are not including email addresses. Either your server-side setup is not enriching events with customer data from the order, or your email collection setup has a gap.
You can ignore the Day-to-day EMQ fluctuations. EMQ is calculated on a rolling 24 to 48 hour window. It will move slightly. What matters is the trend over weeks, not the number on any given Tuesday.
A sustained EMQ below the healthy ranges above, or a significant drop over a 1 to 2 week period is worth to act on.
What the Warnings Actually Mean
The Diagnostics tab is where Events Manager flags potential issues with your setup. Most brands either ignore it entirely or treat every warning as an emergency. Neither is right.
Here is how to read it.
"Update recommended" vs. "Issue detected"
These are two different severity levels.
"Update recommended" means Meta has noticed something that could be improved but is not actively breaking your tracking. These are worth investigating but not urgent. Common examples: events missing certain optional parameters, or your EMQ being in a suboptimal but not critical range.
"Issue detected" means something is actually wrong and is likely affecting your data quality. These should be addressed promptly. Common examples: events not being received for an extended period, deduplication failures, or critical parameters missing from high-priority events.
Common Diagnostics You Will See
"Pixel hasn't received events recently" This one matters. If your Purchase event shows this, your browser Pixel is not firing on your checkout. Go check whether your Pixel is still installed correctly, or whether a Shopify update or app change has disrupted it.
"Event match quality can be improved" This is Meta's way of saying your EMQ score is lower than it could be. Click through to see which parameters you are missing. Almost always it comes down to email address not being passed correctly.
"Possible duplicate events detected" This is a deduplication warning. Meta is seeing what look like duplicate Purchase events same purchase counted multiple times. This means your event_id values are not matching between your browser Pixel and your CAPI, or you have deduplication off entirely. This needs to be fixed.
"Browser pixel not detected" If you have moved entirely to server-side tracking without a browser Pixel component, this will appear. It is not necessarily a problem but you should confirm you are still capturing Click IDs (fbc) through your server-side setup, because without them your attribution quality will decline.
The Test Events Tab (Your Best Diagnostic Tool)
If you want to check whether your tracking is actually working correctly not just whether Meta is receiving events, but whether they are firing at the right time with the right data the Test Events tab is your friend.
Here is how to use it:
- Click Test Events in Events Manager
- Copy the test code and paste it in the field
- Open your store in another tab with the test code appended to the URL
- Go through the actions you want to test. Browse a product, add to cart, go through checkout
- Watch Events Manager in real time as your events come through
What to check in each event payload:
For a Purchase event, click through to see the full event data. You want to confirm:
event_name: Purchaseevent_id: present and matches what your CAPI is sendingemail(hashed): present.Tthis is the most critical parameter for EMQfbc: present. This is the Click ID from Meta ads, critical for attributionfbp: present. Browser cookie that helps with session identityvalueandcurrency: present and correctcontentsandnum_items: present
If any of these are missing from a real purchase event in Test Events, you know exactly what your EMQ and attribution issues are.
The History Tab (The One Everyone Forgets)
The History tab logs changes to your pixel configuration and integration settings. Most people never look at it.
It is useful for exactly one thing: figuring out when something changed.
If your EMQ dropped on a specific date, or your event volume fell off a cliff, or your deduplication rate went to zero go to History and look at what changed around that date. App installations, pixel configuration changes, integration updates. The answer is usually there.
Healthy vs. Concerning
| What You See | Healthy | Concerning |
|---|---|---|
| Purchase Integration | Conversions API (or both) | Meta Pixel only |
| Purchase EMQ | 8.8 to 9.3 | Below 8.0 |
| AddToCart EMQ | 7.5 to 8.5 | Below 7.0 |
| Deduplication rate | 60 to 90% | 0% or not shown |
| Diagnostics | "Update recommended" | "Issue detected" |
| Event volume | Stable funnel shape | Sudden drops on specific dates |
The One Thing to Do Right Now
If you have not opened Events Manager in the last 30 days, go look at three things today:
- Compare your Purchase event volume in Events Manager to your actual Shopify order count for the same period. They should be within 5 percent. A bigger gap means your tracking has a hole.
- Check your Purchase EMQ. If it is below 8.0, you have a data enrichment problem almost certainly missing email parameters on your server-side events.
- Look at the Diagnostics tab. If there are any "Issue detected" flags (not just "Update recommended"), address those before anything else.
Everything else in this dashboard is context. Those three things are the health check.
How to Boost EMQ
When a brand installs Aimerce server-side tracking on Shopify, their Events Manager typically normalizes within 24 hours. What that looks like:
Purchase integration shows Conversions API. EMQ moves into the 8.8 to 9.3 range as server-side events start enriching each purchase with email, phone, and customer data from the Shopify order. Deduplication rate stabilizes in the 60 to 90 percent range. Diagnostics clear up.
The underlying reason is the architecture. WebPixel captures browser-side behavioral events and Click IDs, Shopify Webhooks capture server-side orders with full customer data, and deduplication is handled automatically using Shopify order IDs as event_id values.
If your Events Manager looks different from that description right now, you know what to work toward.
30-Day Aimerce Pixel Free Trial