
Quick Answer: Aimerce added four new reports for Shopify brands. Ads Overview shows revenue, ad spend, ROAS, MER, and new customer CPA across all your ad channels, plus Meta, Google, and OpenAI Ads individually. Pacing tracks spend, revenue, new customer CPA, and ROAS by day, week, or month, and highlights days that are well above or below average. Products shows sales, net revenue after discounts, and purchase rate for each product. Landing Pages shows how visitors convert based on the page they first land on, including new customers. All four are in the Aimerce dashboard, with a time range and currency setting, and Pacing, Products, and Landing Pages export to CSV.
Key Takeaways
- Ads Overview puts blended metrics like MER next to channel-level results, so you can see if you're actually scaling profitably.
- Pacing shows whether extra spend brings in new customers, not just a bigger bill.
- Products shows net revenue after discounts, which is a better guide to your best products than total sales.
- Landing Pages shows which entry pages bring in buyers and new customers, and where shoppers drop off.
- All four use the same data, so you stop matching numbers across Shopify, ad managers, and spreadsheets.
When you raised spend on Tuesday, did new customers go up with it, or only the bill?
Which of your products do you think are carrying the month?
Which landing page is the ad traffic actually converting on?
Getting to any one of those usually means opening Shopify analytics, a couple of ad managers, and a spreadsheet, only to waste time matching data that was never counted the same way to begin with.
We've added four new reports to Aimerce to answer exactly those questions. 🥳
| Report | The question it answers |
|---|---|
| 1. Ads Overview | What is your total ad spend returning, overall and by channel? |
| 2. Pacing | How are spend, revenue, and new customers moving from day to day? |
| 3. Products | Which products sell, and how much of that revenue is left after discounts? |
| 4. Landing Pages | Which entry pages turn visits into purchases and new customers? |
But first, we updated the Attribution Dashboard
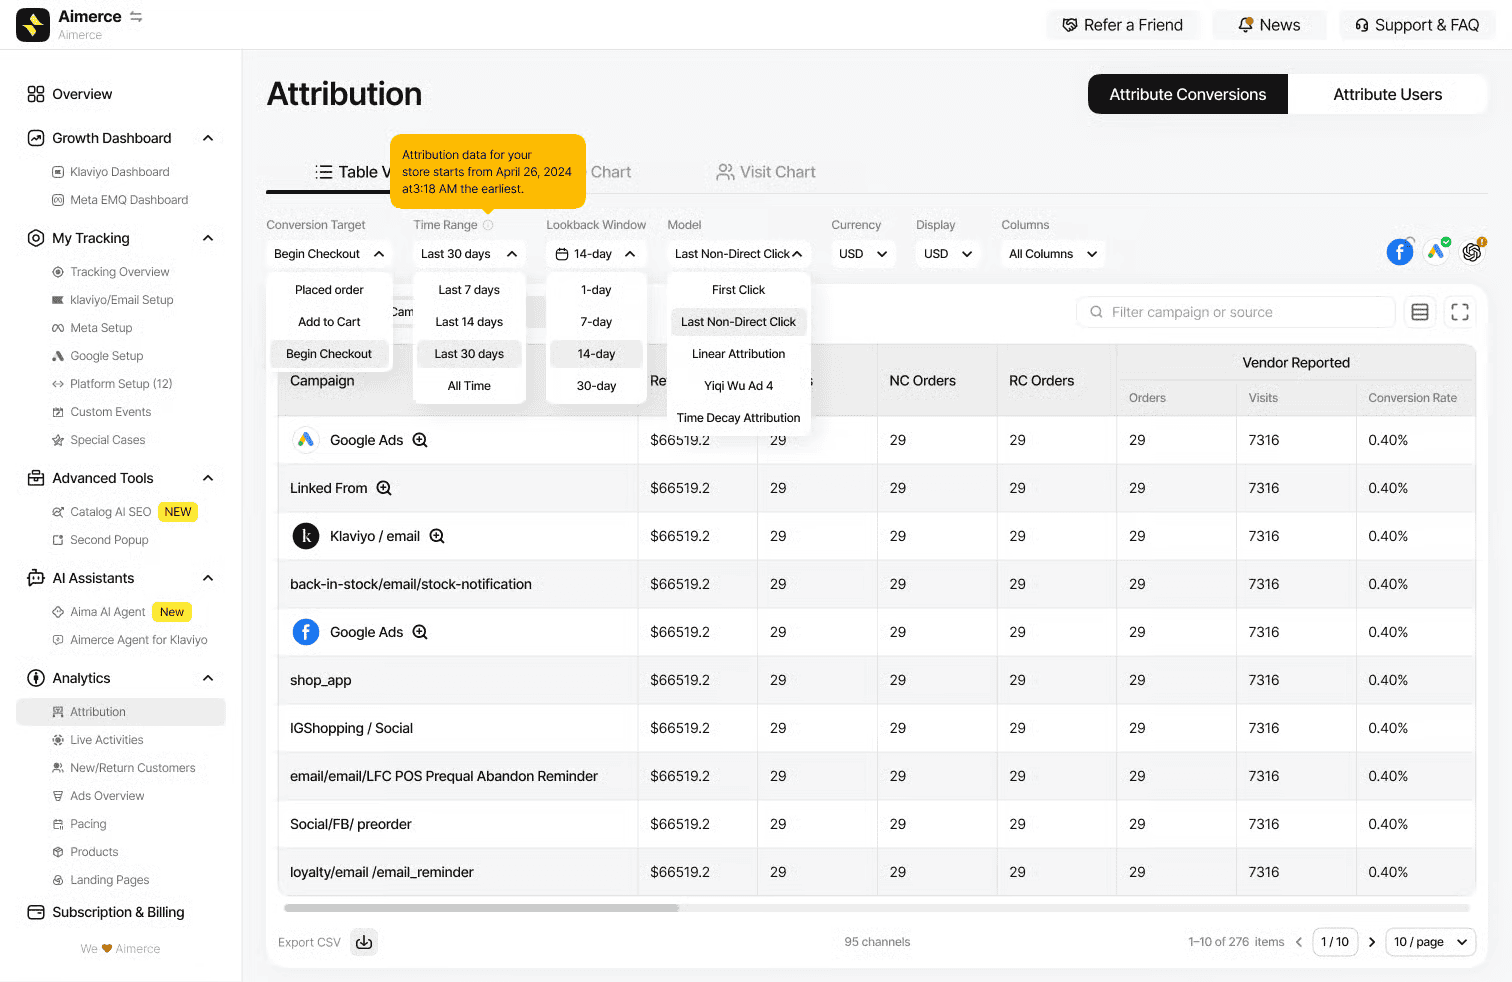 Attribution dashboard puts every channel in one table, with revenue, orders, visits, and conversion rate side by side. From there you can go down to a single campaign, ad set, or ad. You choose the attribution model (first click, last non-direct click, linear, or time decay) and the lookback window.
We've cleaned up the Attribution dashboard to make it way easier to read:
Every platform now gets its own row, with Paid, Organic, and Unknown traffic expandable underneath.We’ve rolled Facebook, Instagram, Audience Network, Threads, and Messenger all into Meta, so your clicks and spend are finally in one place.Campaign, ad set, and ad views are grouped by platform, so one Meta campaign shows up as one row.Each ad set now shows the campaign it belongs to.We added dedicated icons for newer sources like Shop, YouTube, Gemini, Perplexity, and Claude, so you can easily see traffic coming from AI assistants.
- Every platform now gets its own row, with Paid, Organic, and Unknown traffic expandable underneath.
- We’ve rolled Facebook, Instagram, Audience Network, Threads, and Messenger all into Meta, so your clicks and spend are finally in one place.
- Campaign, ad set, and ad views are grouped by platform, so one Meta campaign shows up as one row.
- Each ad set now shows the campaign it belongs to.
- We added dedicated icons for newer sources like Shop, YouTube, Gemini, Perplexity, and Claude, so you can easily see traffic coming from AI assistants.
The totals here aligns perfectly with Ads Overview. Use Ads Overview to see whether your spend is paying off overall, then Attribution to determine where to allocate your next budget.
1. Ads Overview: is your total ad spend paying off?
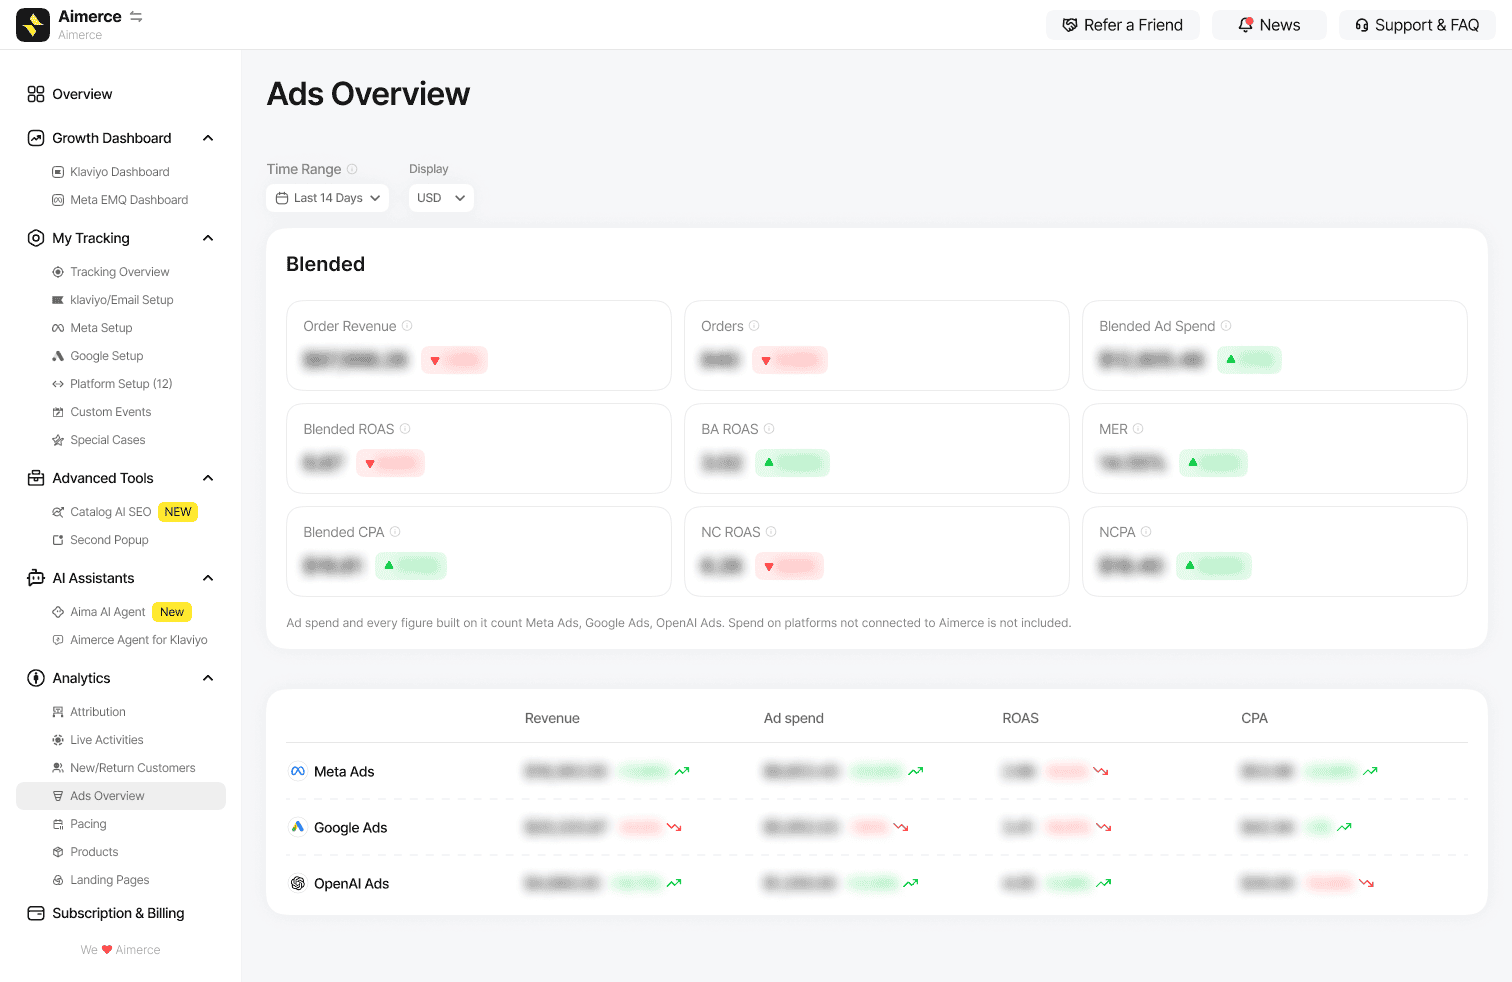 Revenue, ad spend, and performance across your advertising channels, in one place.
The Ads Overview report pulls all your performance data into one easy-to-read dashboard. You'll see your key metrics, like revenue, ROAS, MER, and new customer CPA, at a glance, with arrows showing whether you're trending up or down.
You can also dig deeper to see exactly how Meta, Google, and OpenAI Ads are performing individually.
We're big fans of blended numbers, because they give you the real story without the inflated data you usually get from ad platforms. By comparing your total revenue against your total spend, you'll know for sure whether you're actually scaling profitably.
Note: make sure all your ad platforms are linked to Aimerce, so your blended metrics stay accurate.
2. Pacing: is extra spend bringing in new customers?
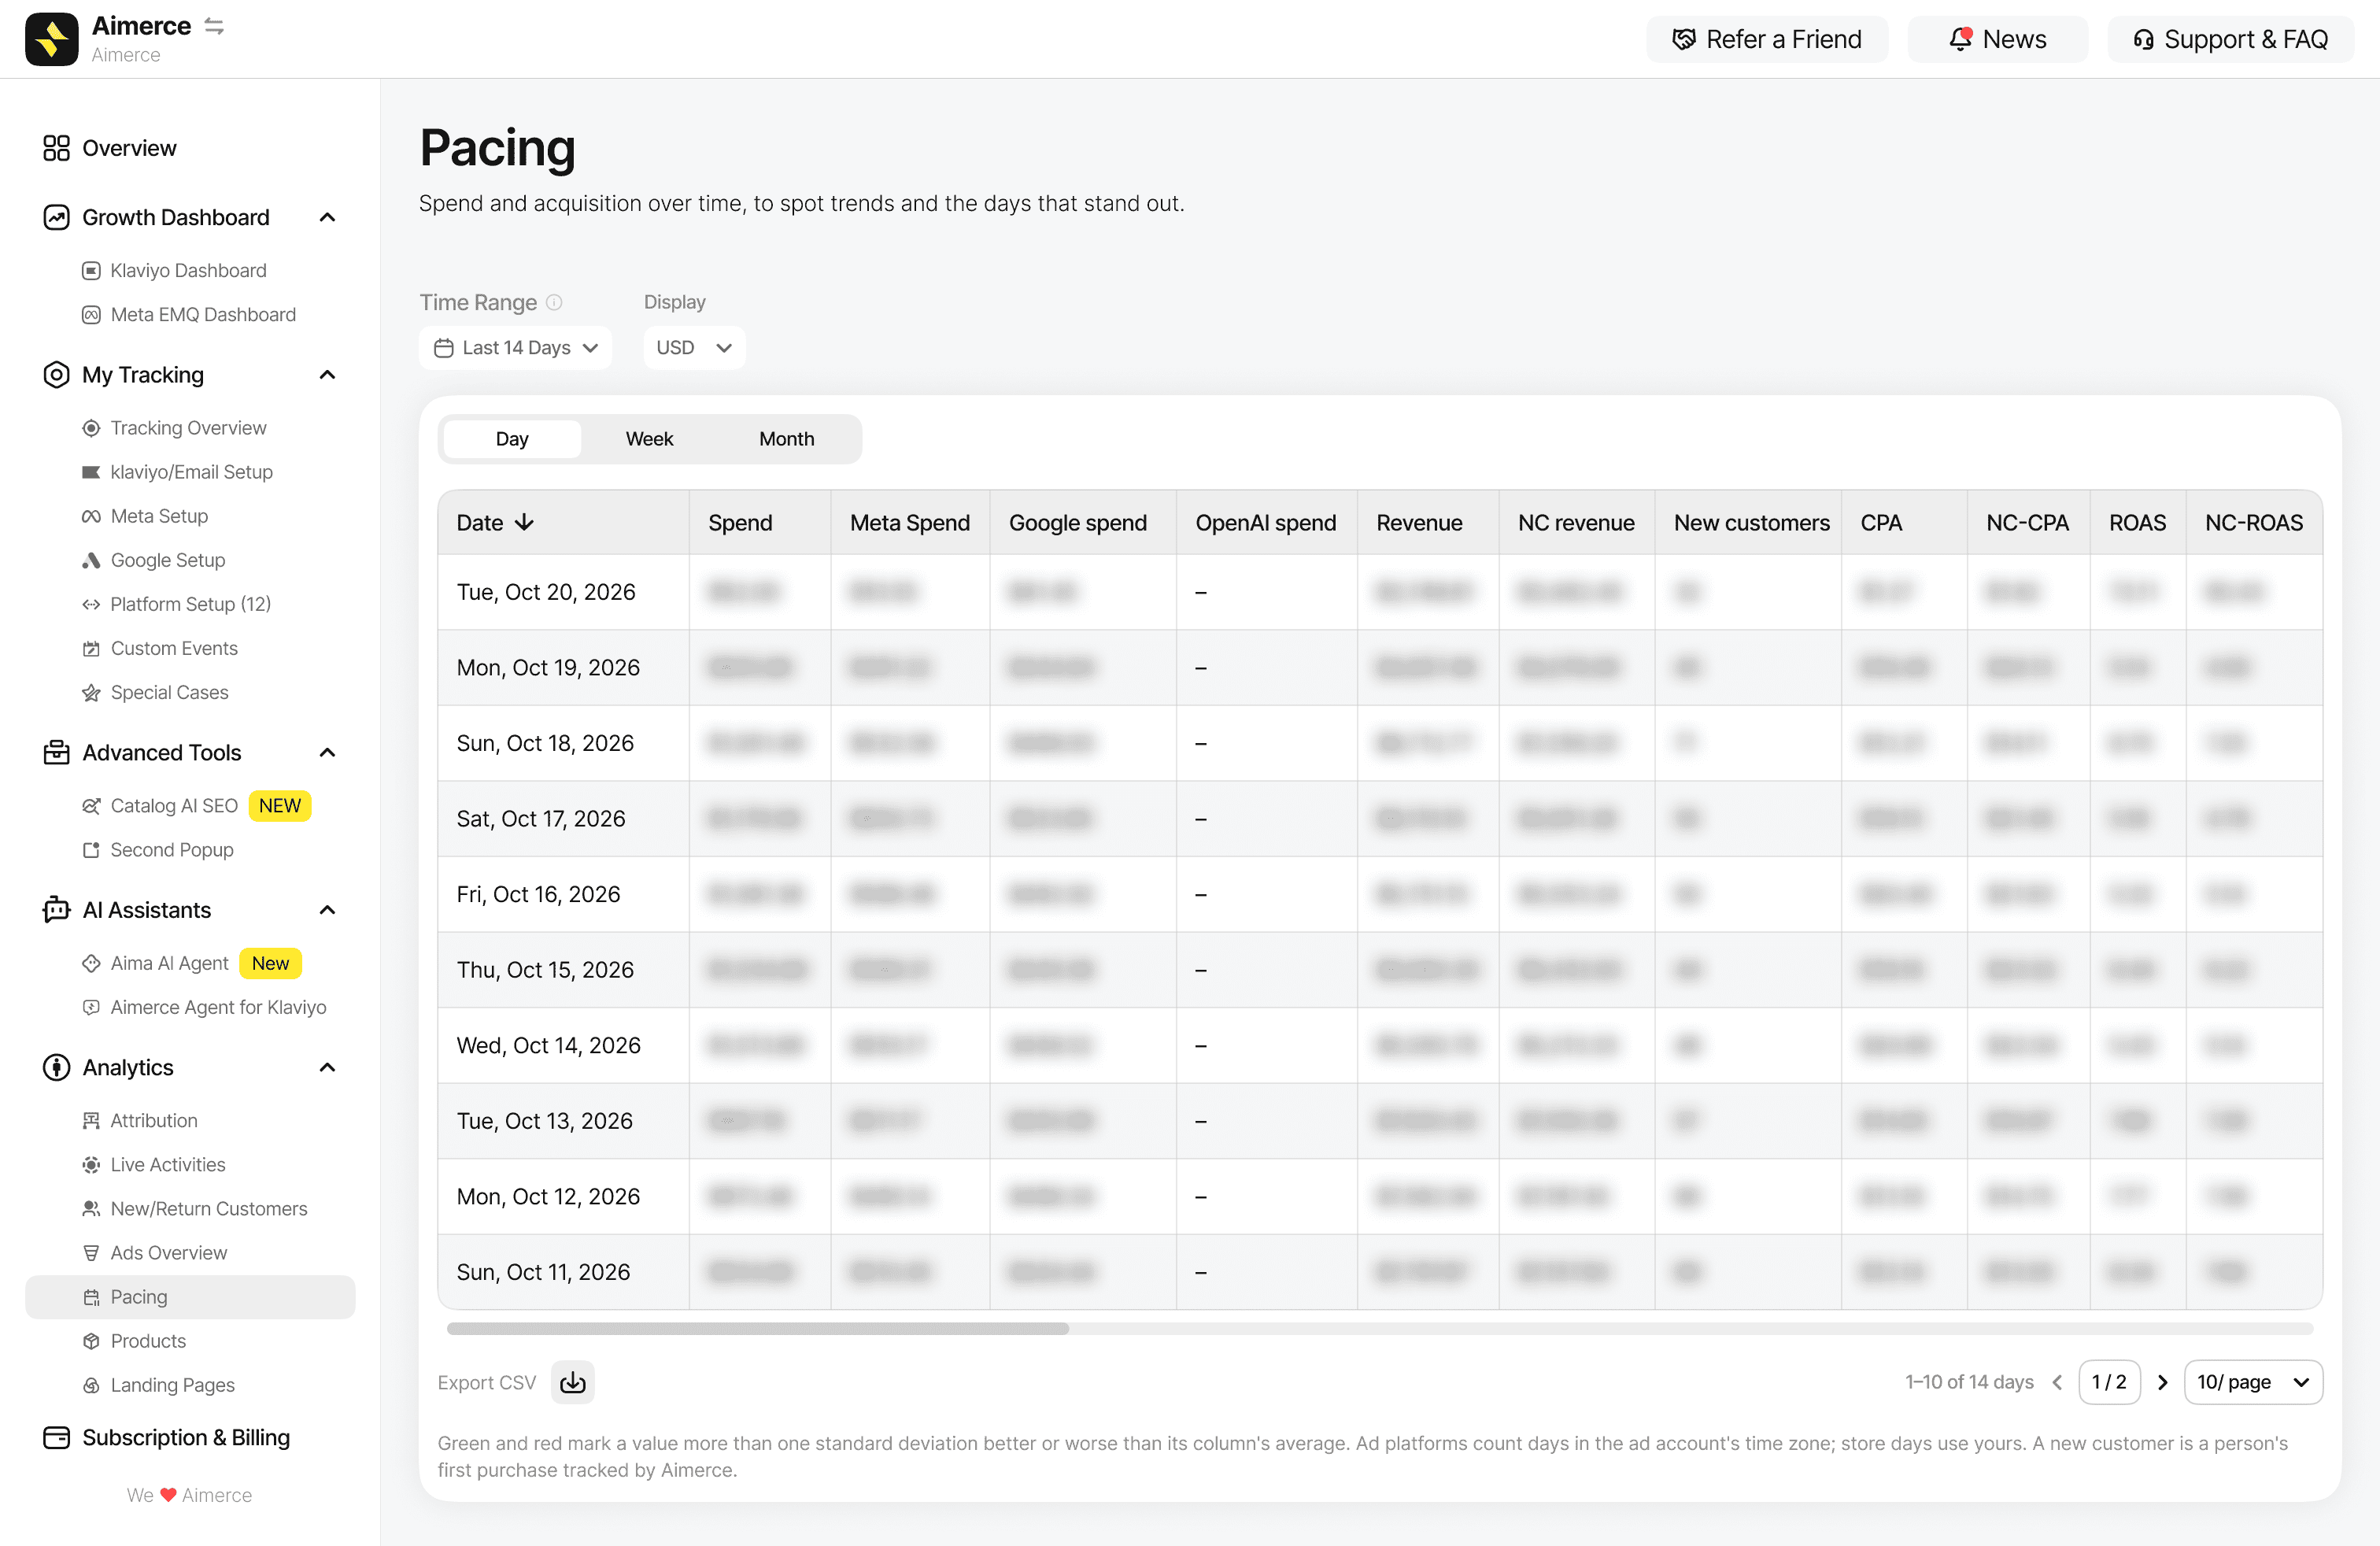
Spend and acquisition over time, so you can spot trends and the days that stand out.
Pacing is your go-to for tracking spend and acquisition by day, week, or month.
It pulls together total spend, revenue, new customer CPA, and ROAS, so you can spot trends and outliers at a glance. To make things even easier, cells turn red or green when performance is well above or below average.
It's perfect for big budget calls, because it shows whether your extra spend is actually bringing in new customers.
Keep in mind: ad platform time zones can differ from your store's, and we define a "new customer" as a first-time buyer.
3. Products: which products earn the most after discounts?
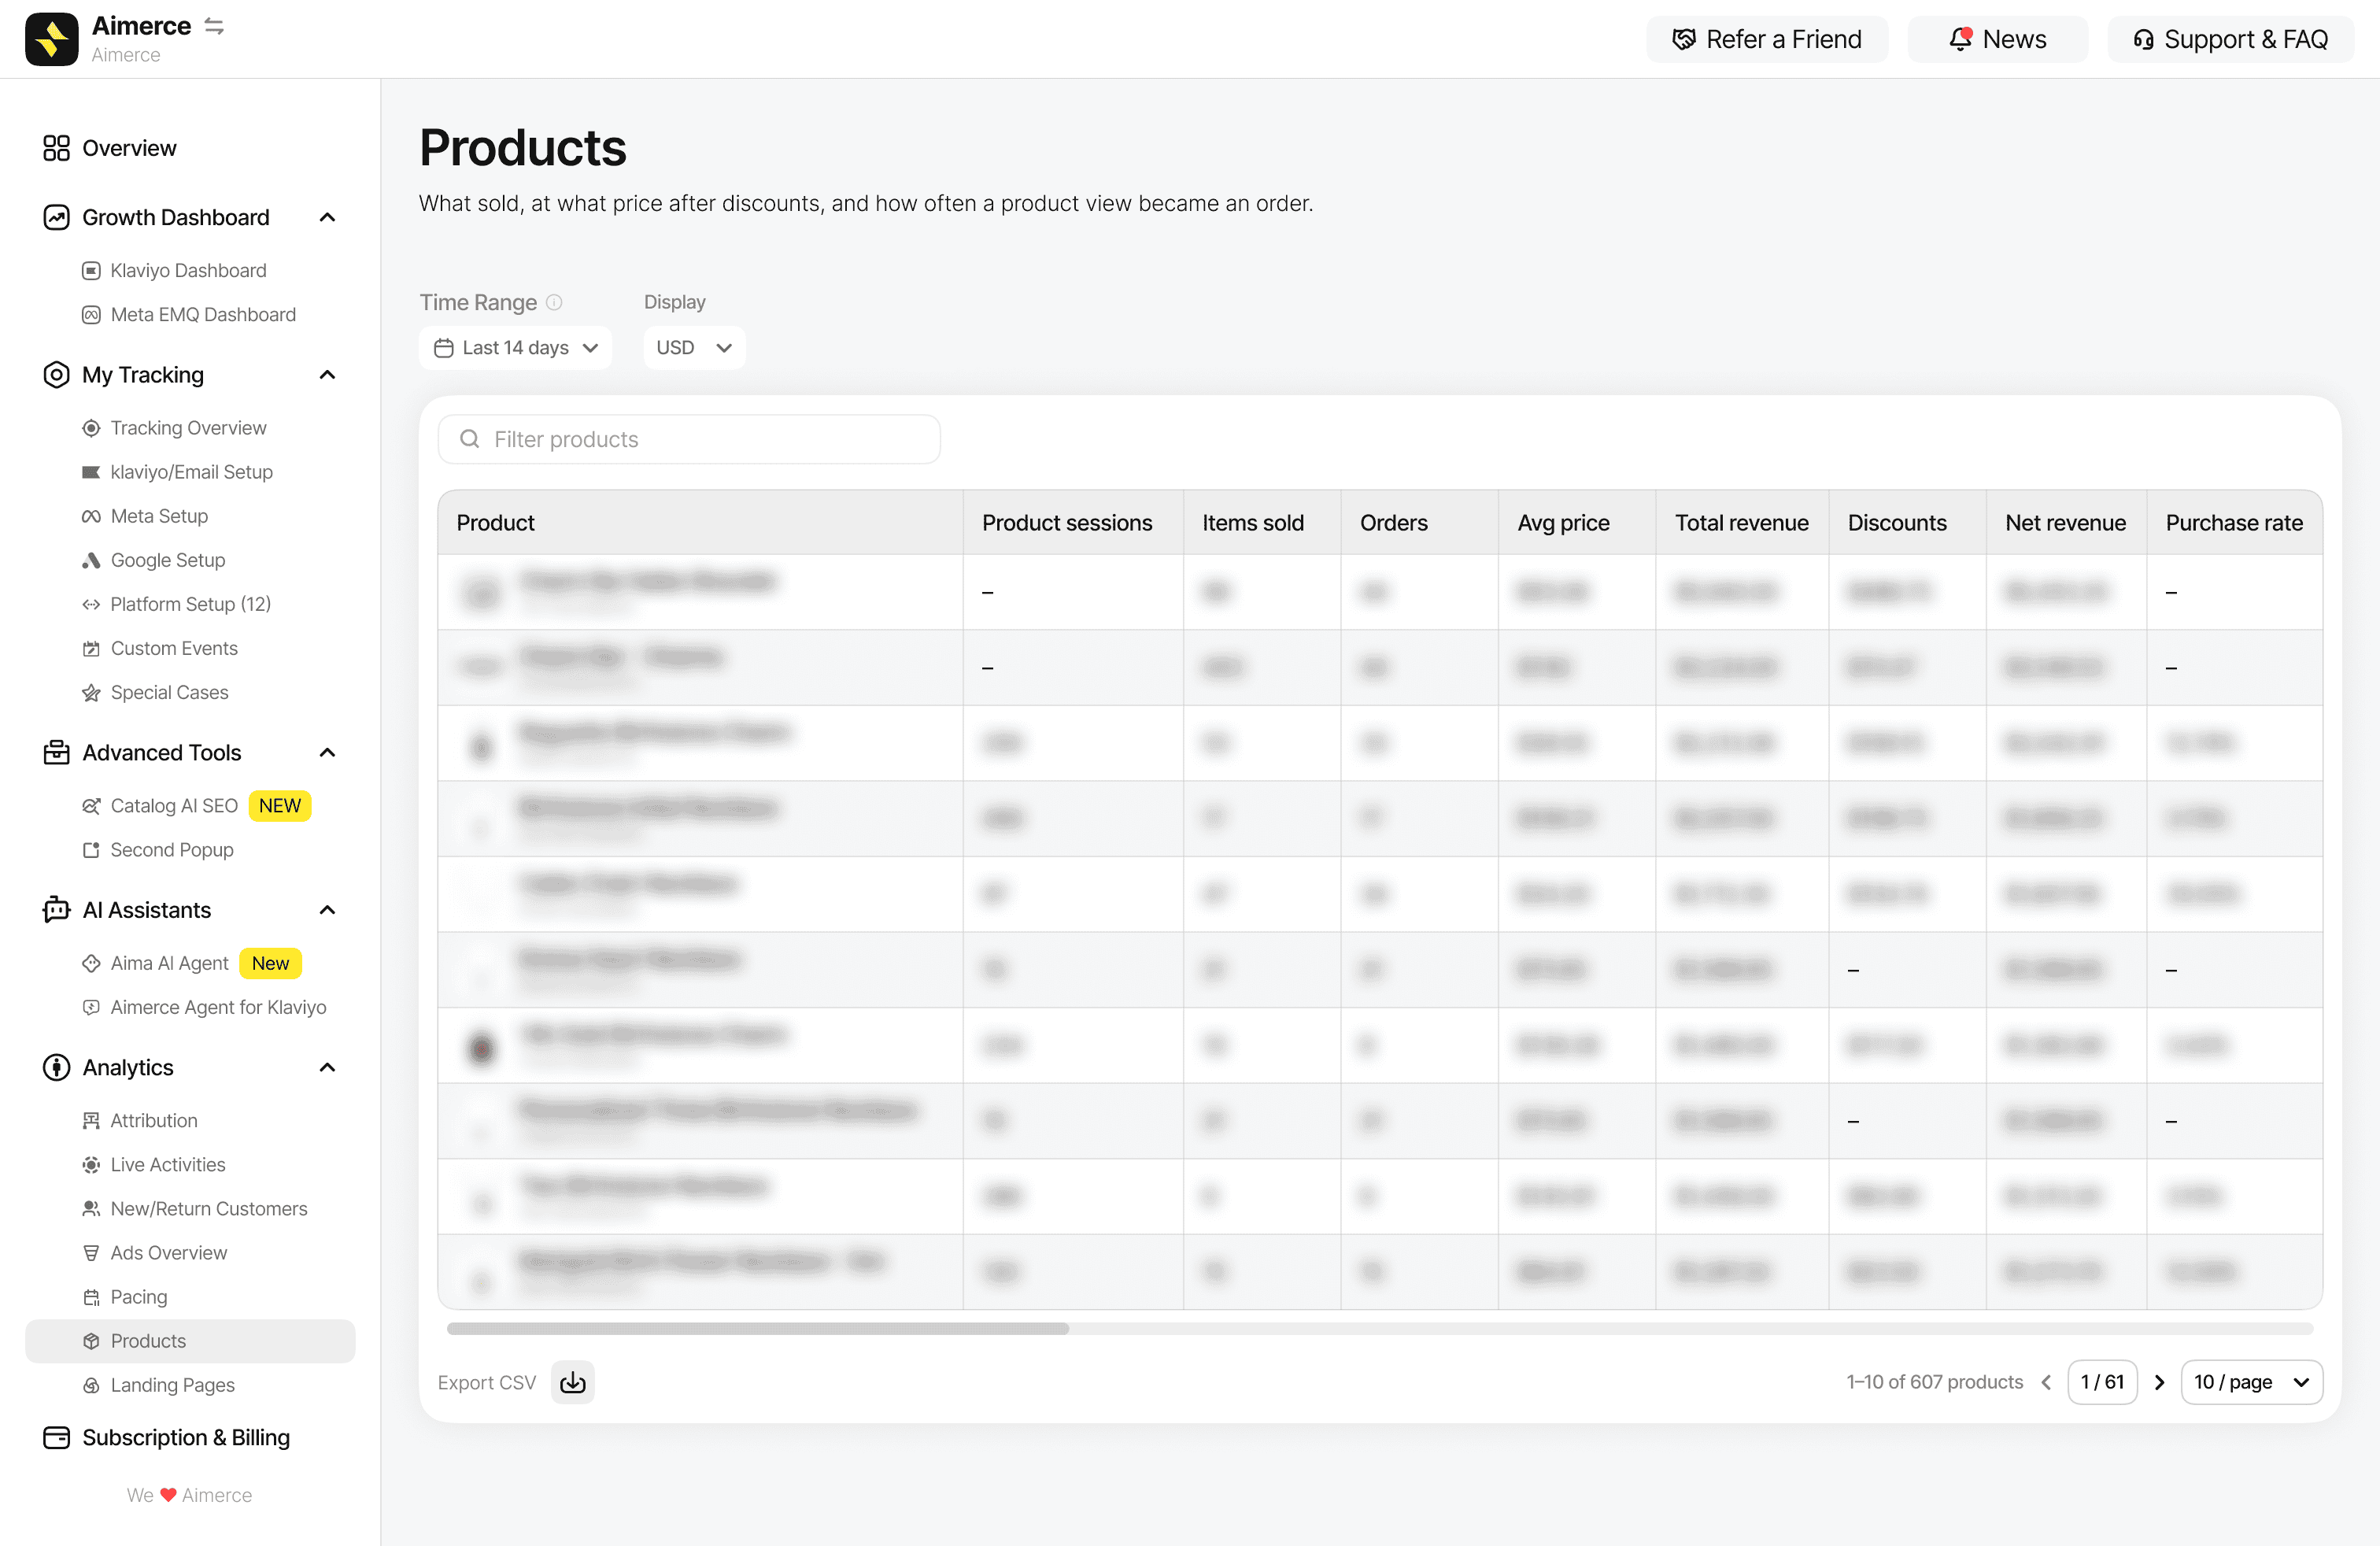
What sold, at what price after discounts, and how often a product view became an order.
The Products report breaks down how your items are actually performing. You can track total sales, net revenue after discounts, and how well your product pages turn browsers into buyers.
We recommend watching the Net Revenue column to find your most profitable items, and using Purchase Rate to decide which products need more traffic and which need a better page.
4. Landing Pages: where do visitors convert, and where do they drop off?
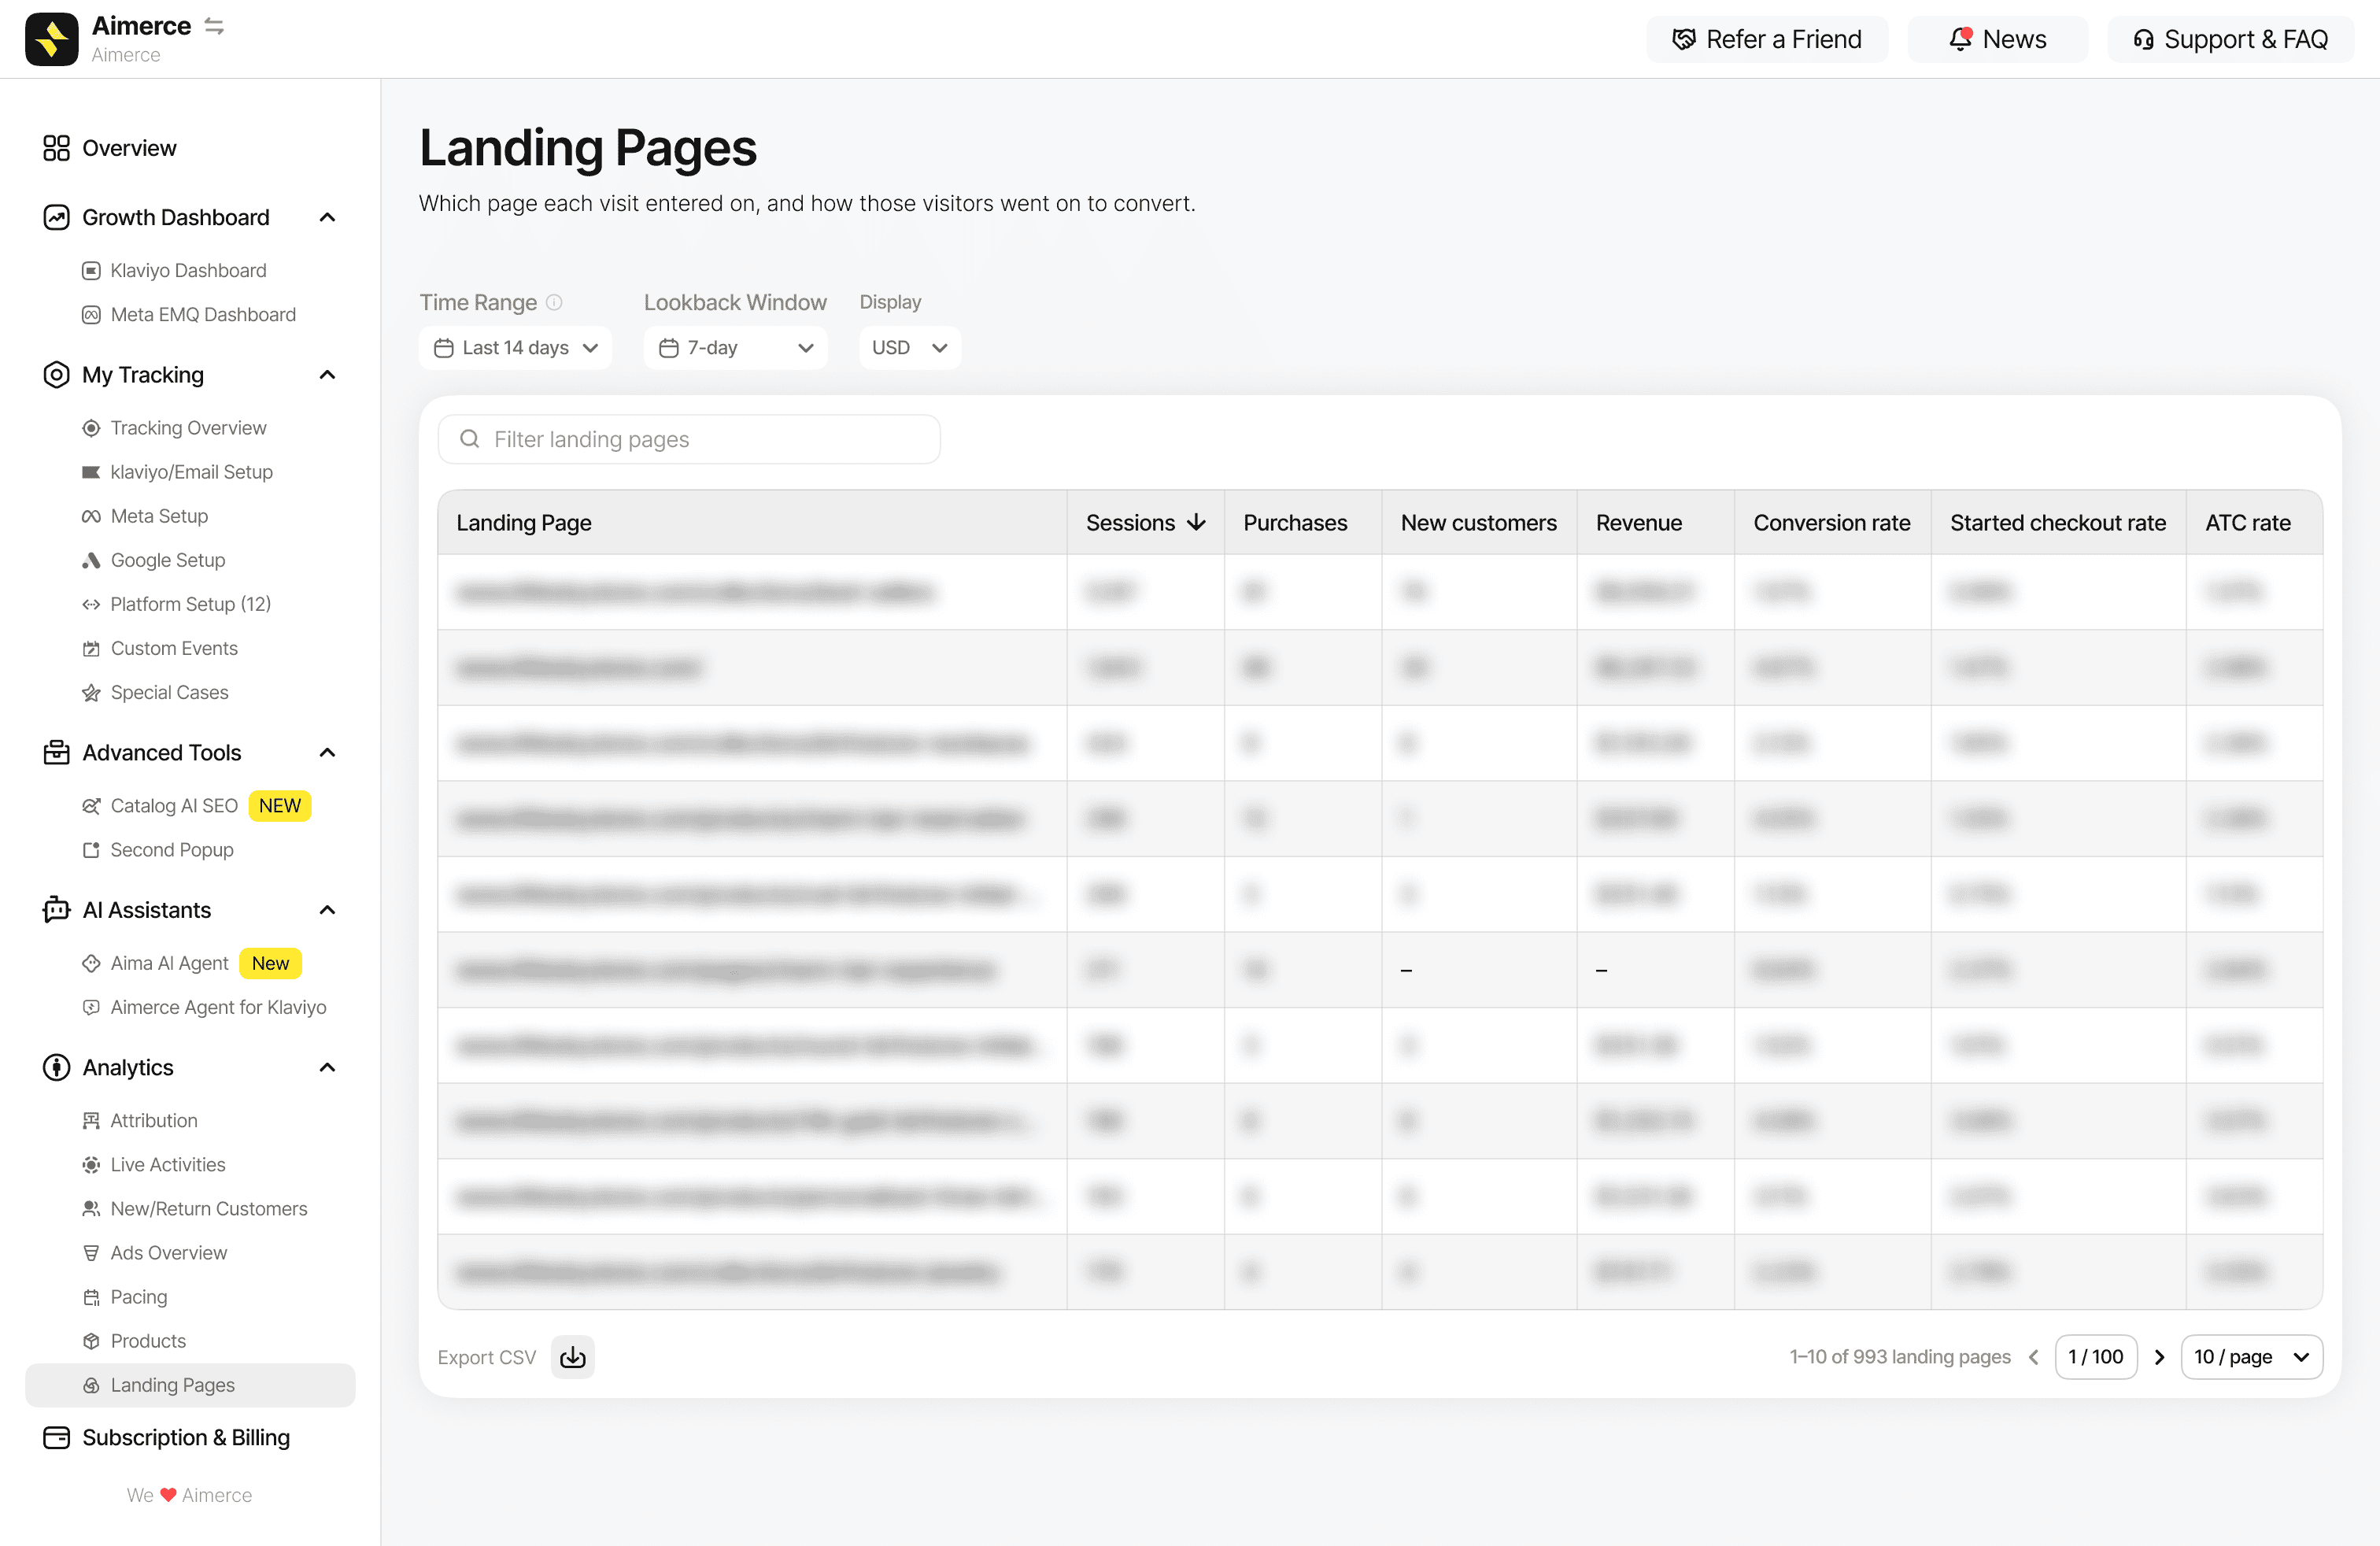
Which page each visit entered on, and how those visitors went on to convert.
The Landing Pages report shows how people convert based on where they first land on your site. You'll see all the big metrics, like sessions, revenue, and new customer counts. A lookback window lets you set how long after the visit a purchase still counts toward that page.
It's a great way to spot where you're losing shoppers. If they make it to checkout but don't buy, there's likely friction with shipping or payments. If they aren't even starting checkout, the problem is earlier, on the page itself. You can also use the New Customers column to see which pages are actually pulling in new buyers.
The metrics in these reports, defined
| Metric | What it means |
|---|---|
| MER (marketing efficiency ratio) | Total revenue divided by total ad spend, across all channels |
| Blended ROAS | Return on ad spend calculated from your total revenue and total spend, rather than each platform's own attribution |
| New customer CPA (NC-CPA) | Ad spend divided by the number of first-time buyers |
| Net revenue | Product revenue after discounts |
| Purchase rate | How often a product view turned into an order |
| Lookback window | How long after a landing page visit a purchase still counts toward that page |
Where to find them
All four reports are live in your Aimerce dashboard. Each has a time range and a currency setting at the top, and Pacing, Products, and Landing Pages export to CSV if you're a spreadsheet person.
Which one are you opening first?
P.S. If you only have time to build one habit before your next big sale, make it Pacing. I recommend checking it in Day view every morning before making any budget changes.
FAQ
What is MER in ecommerce? MER, or marketing efficiency ratio, is your total revenue divided by your total ad spend across all channels. It shows whether your overall spend is paying off, without relying on each ad platform's own attribution.
What's the difference between MER and ROAS? Platform ROAS uses each ad platform's own attribution, so channels can claim the same order. MER compares total revenue with total spend, so it isn't inflated by overlapping claims.
What is new customer CPA? The cost to acquire a first-time buyer: ad spend divided by the number of new customers in the same period.
Which ad channels does Aimerce's Ads Overview report include? It shows blended results across your linked ad platforms, and Meta, Google, and OpenAI Ads individually. Link all your ad platforms to Aimerce so the blended numbers stay accurate.
How does Aimerce define a new customer in these reports? A new customer is a first-time buyer.
Can I export Aimerce reports? Yes. Pacing, Products, and Landing Pages export to CSV.
Related reading

Try Aimerce Pixel Risk-Free
for 30 Days
Most teams see results within 2 weeks.
Money-back guarantee.
It pays for itself, or you don't pay anything.
30-Day Aimerce Pixel Free Trial